Embeddables
Interactive maps and print-resolution stills, free to embed or reproduce with attribution
Everything on this page is free to use in reporting, online or in print, with the attribution given below. The interactives are self-contained iframes — no API key, no tracking, nothing to install.
Two different datasets on this site — don’t mix their numbers. The embeds below use Meta/WRI CHMv2 (satellite, leaf-on, 2020), deliberately, so Swiss cities can be compared directly with the 25 European cities in the companion project. The Story and Methods pages use Swiss cantonal LiDAR (airborne, leaf-off, multiple years), which is what allows change over time to be measured. CHMv2 reads roughly 18% higher because it sees summer foliage. Both are correct on their own basis; quoting one beside the other in the same sentence would look like an error.
Single-city interactive
Every building coloured by how much tree canopy sits within 60 m of it. Green means at or above the 30% threshold associated with measurable cooling (Ziter et al. 2019); red means none. Readers can pan, zoom, switch city, and fade the overlay to see the streets underneath.
Options
| Parameter | Effect |
|---|---|
?city=zurich / ?city=geneva |
Which city opens first. A #zurich hash works too. |
?lang=de |
German interface — city names become Zürich / Genf. |
?lang=fr |
French interface — Genève. |
| (none) | English, opens on Geneva. |
Combine them freely, e.g. embeds/swiss-city.html?city=zurich&lang=de. The dropdown lets a reader switch cities without reloading; arrow keys work as well.
The map opens on the built-up core rather than the whole functional urban area — the underlying dataset covers 2,590 km² around Zurich and would otherwise open too wide to read. Zoom out to see the full extent.
Print-resolution stills
For print, where an interactive is no use. 300 dpi, opaque white background, no basemap — so they reproduce cleanly on paper and carry no third-party map attribution to clear.
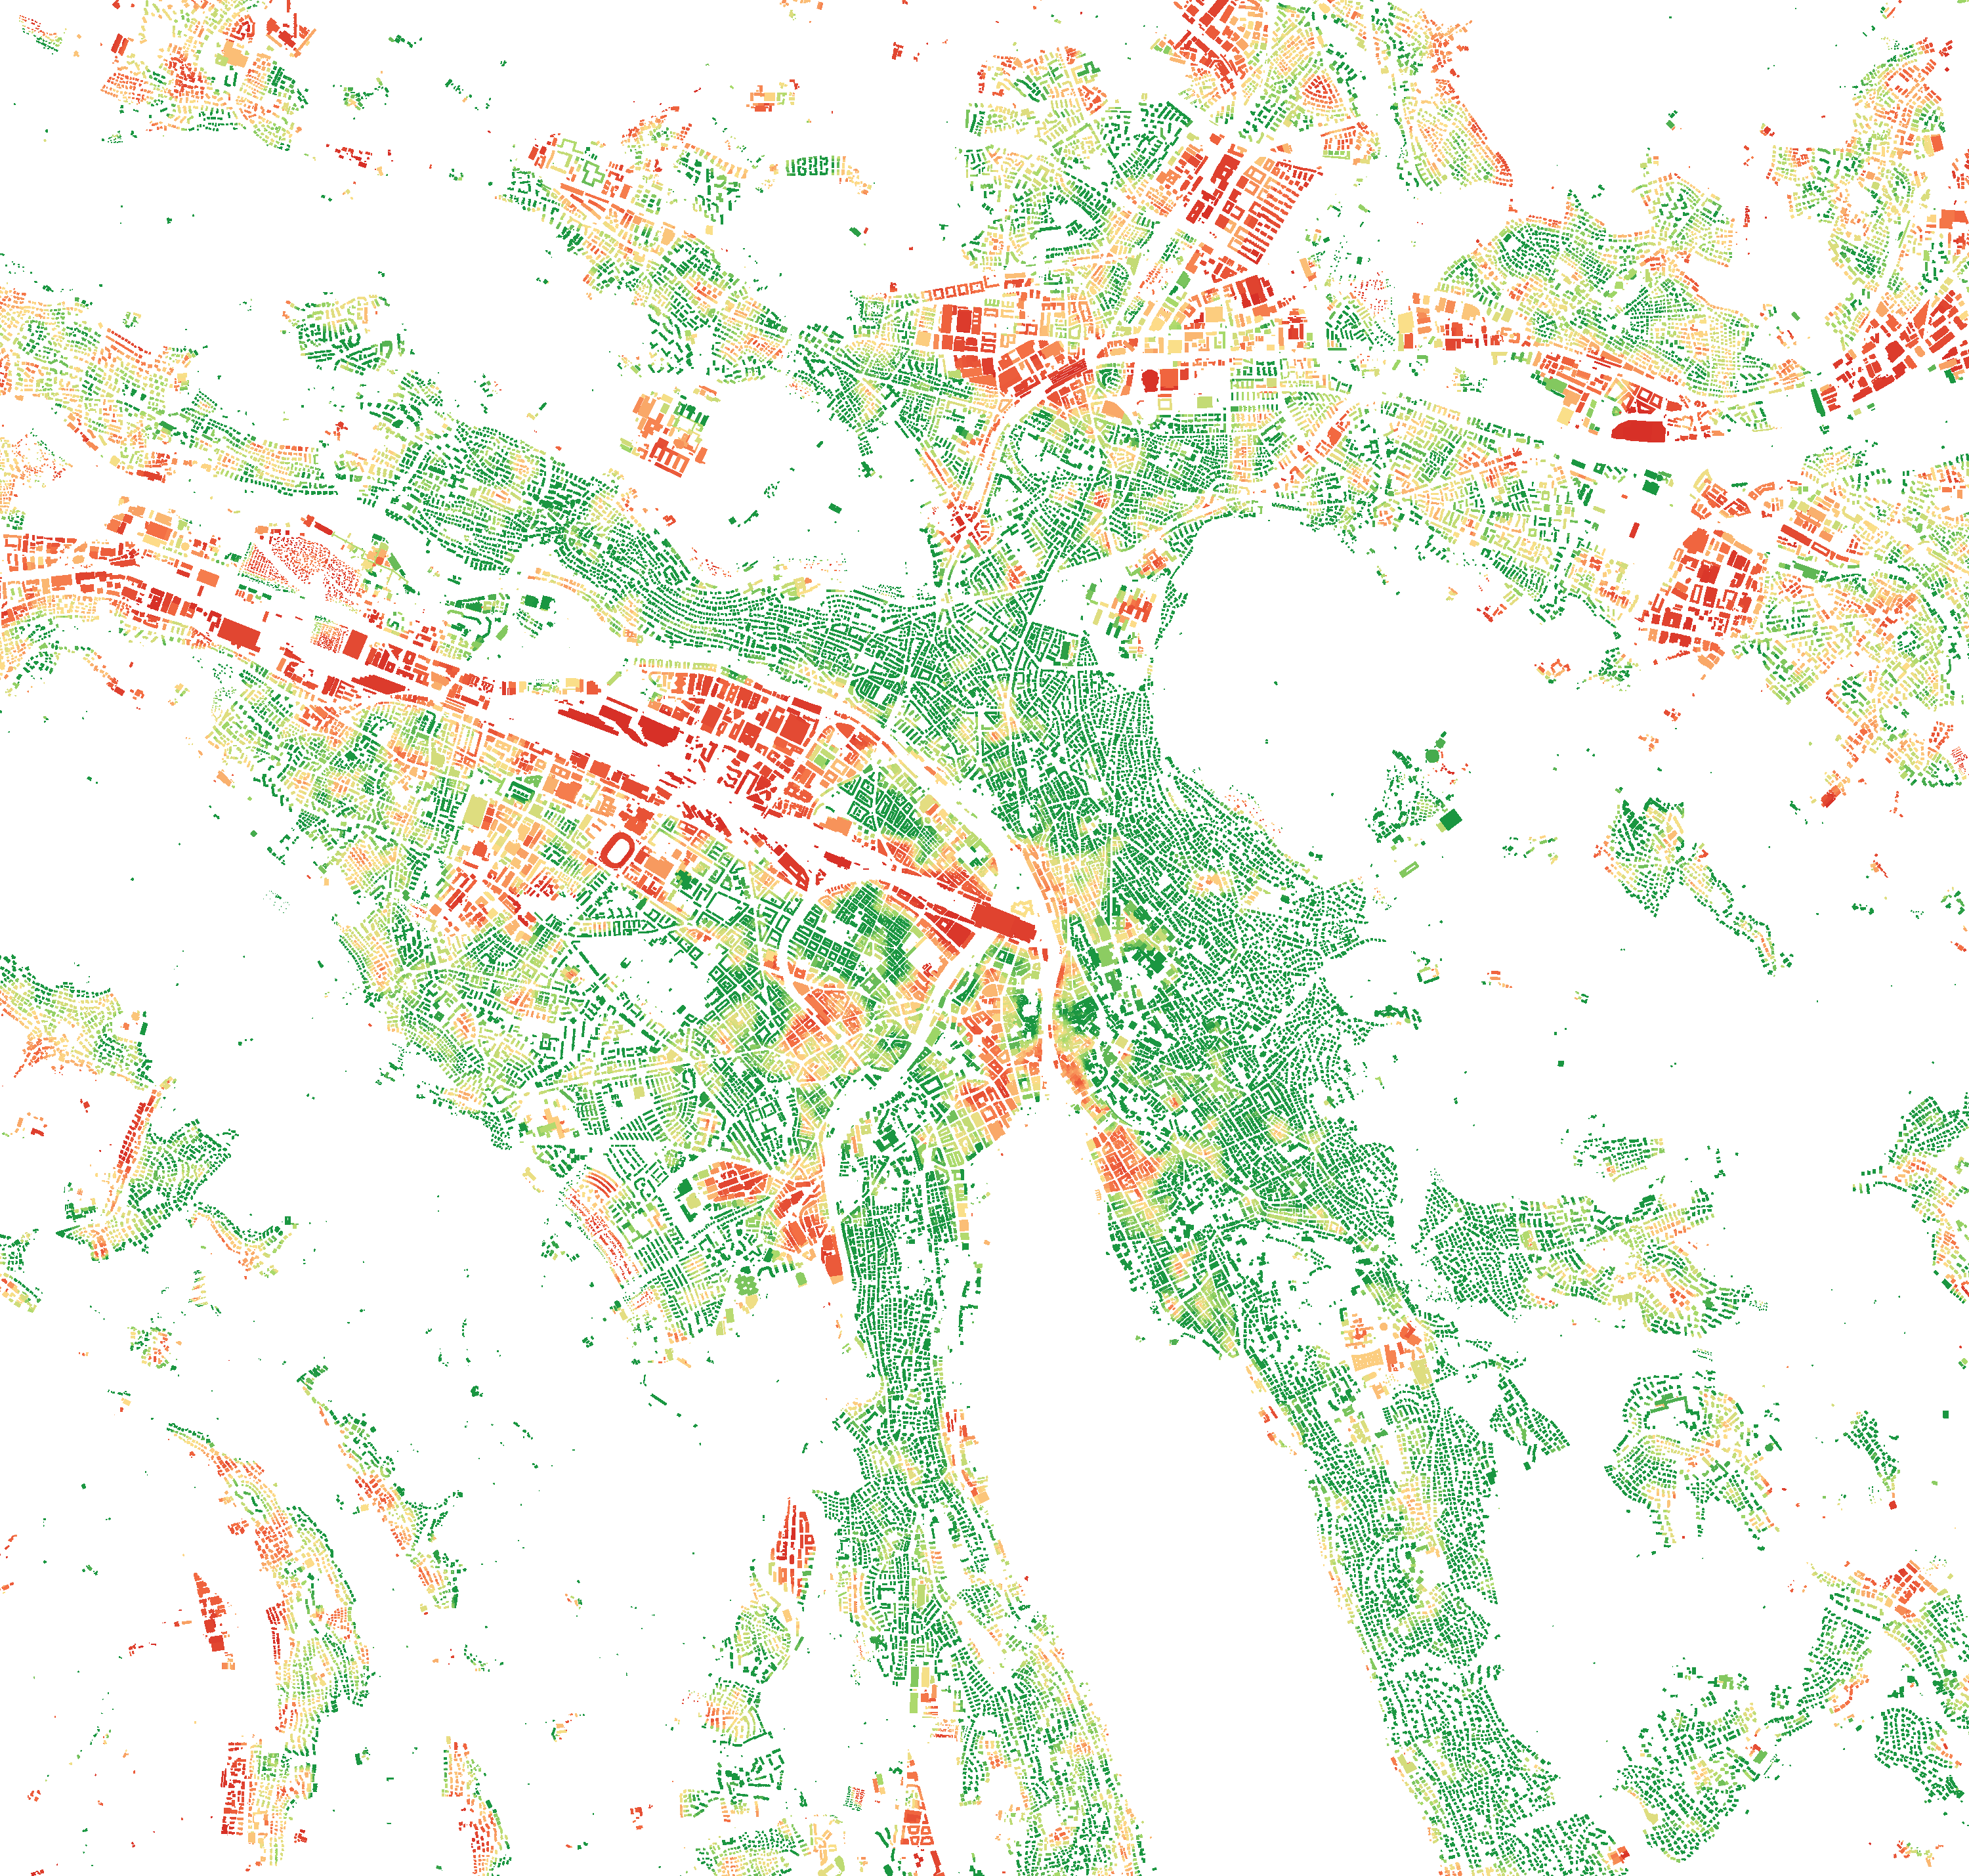
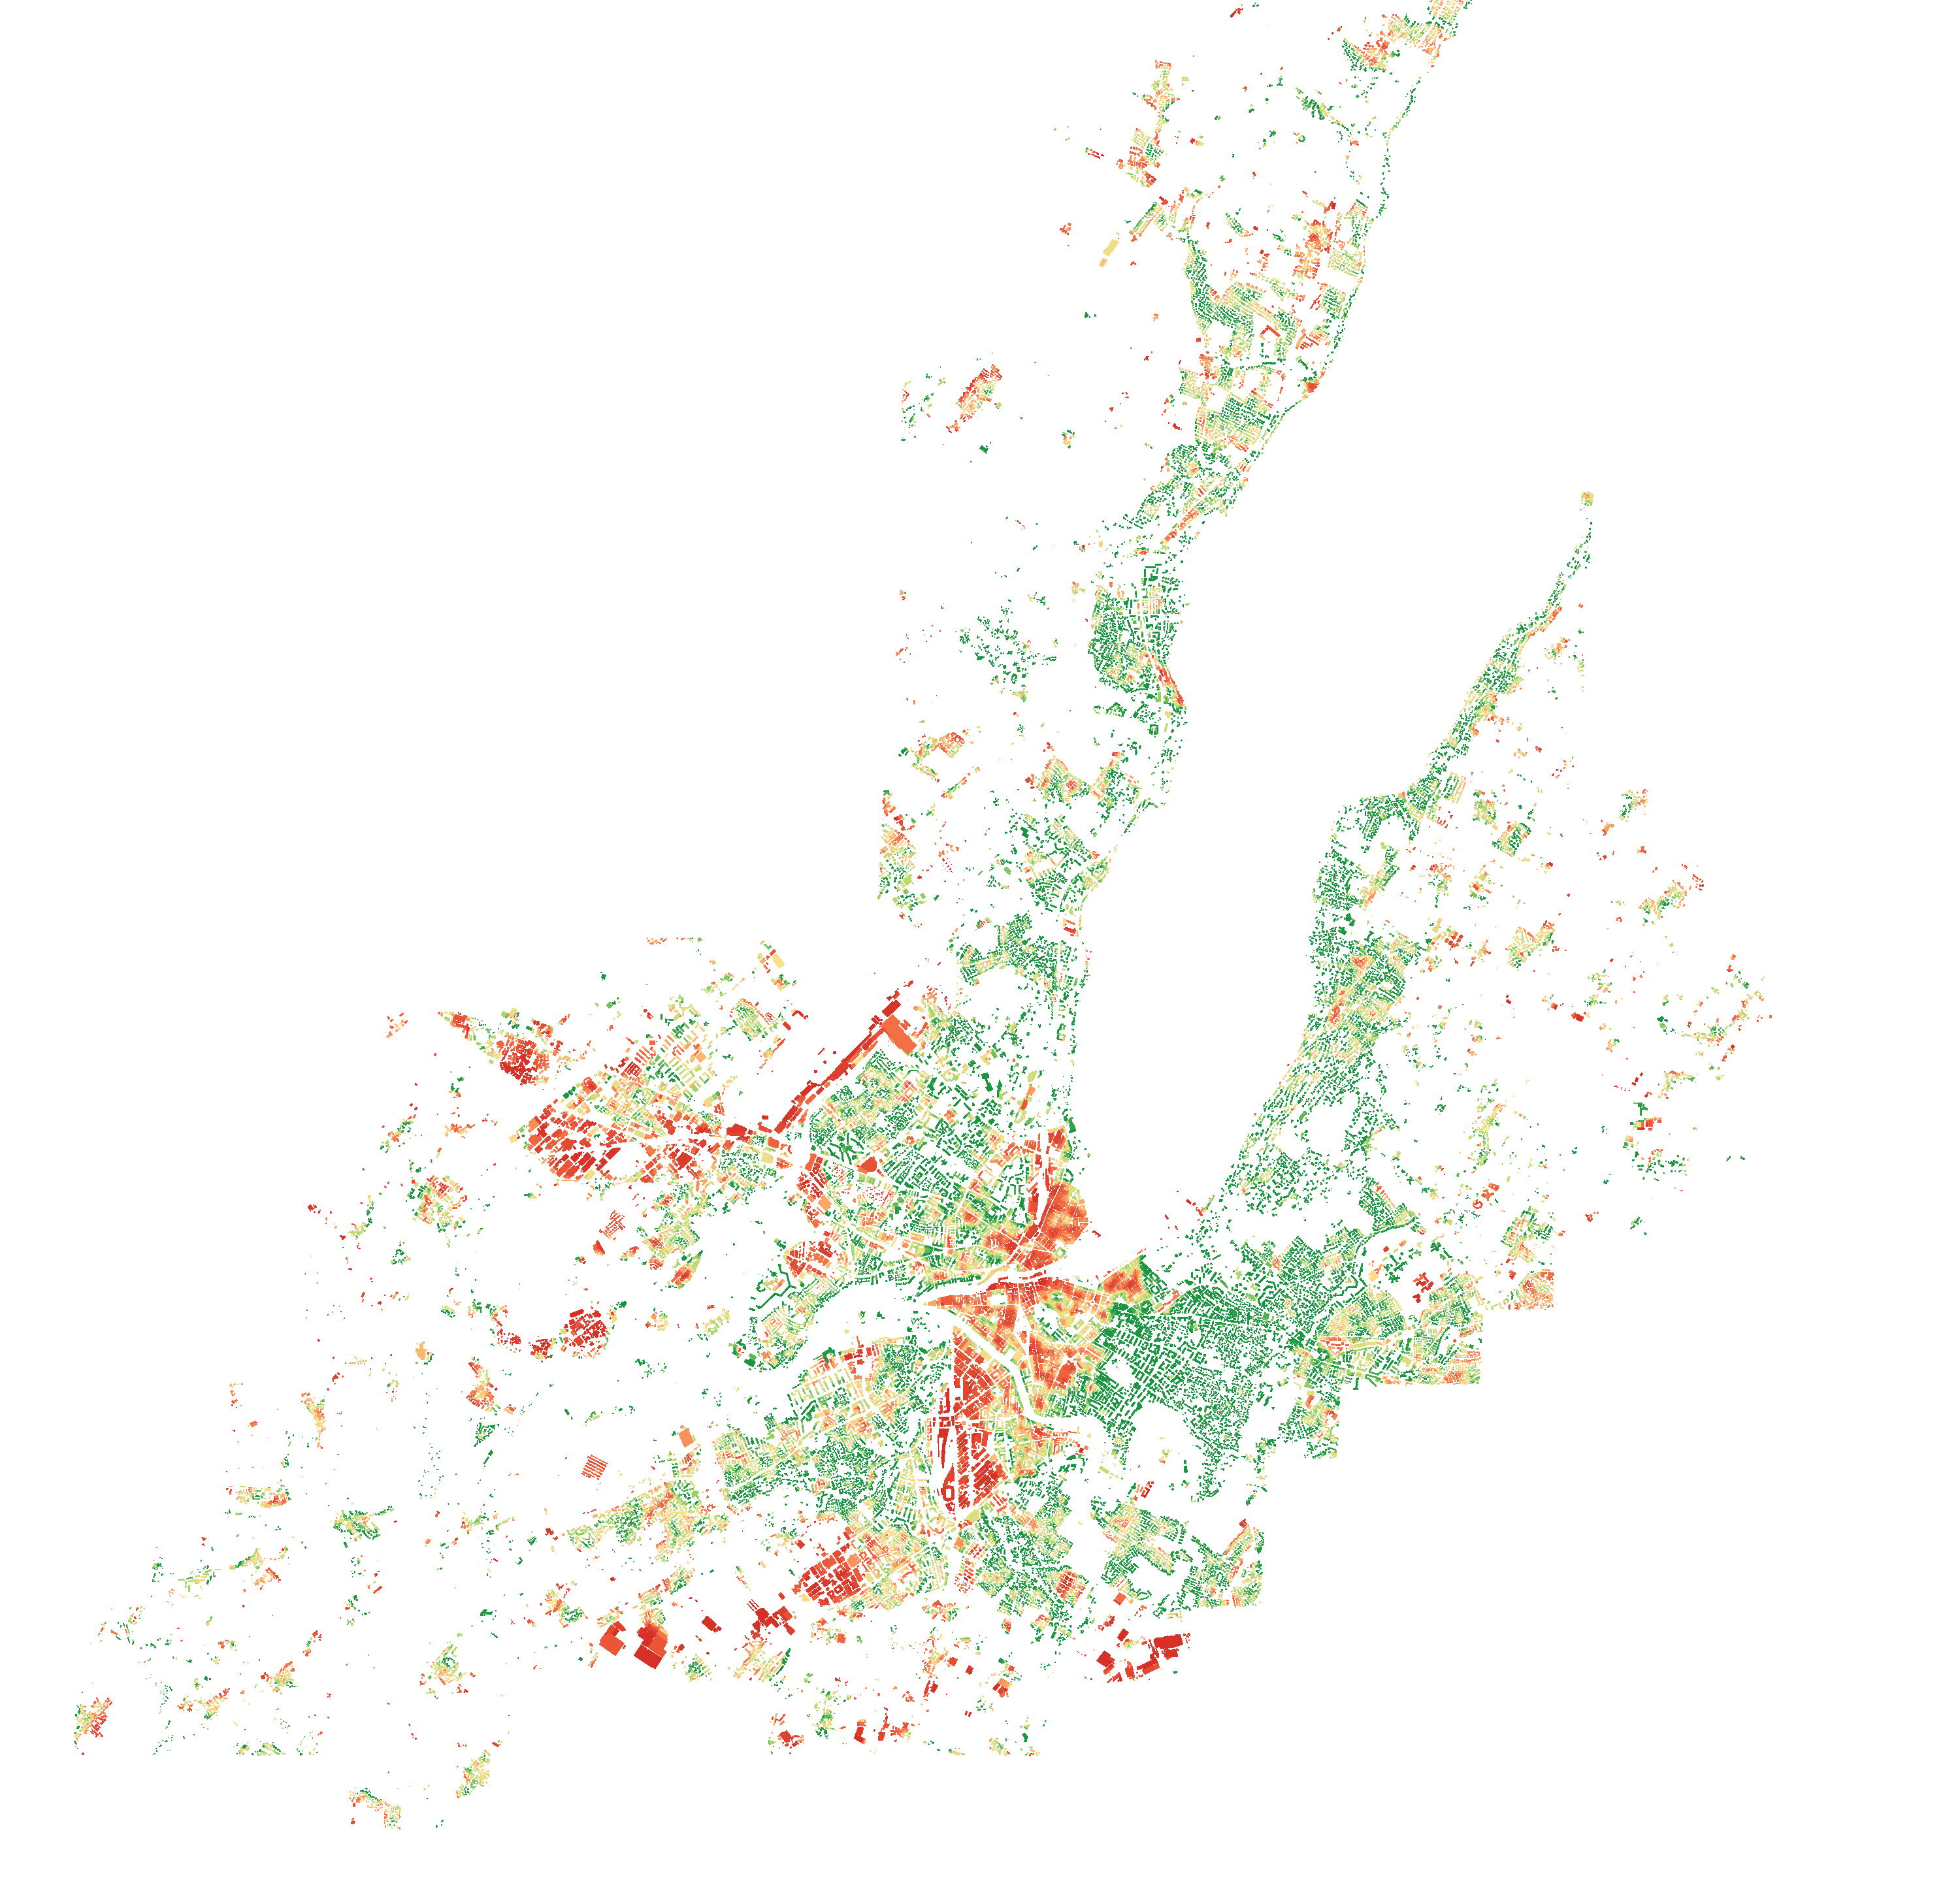
Same colour scale as the interactives: dark green at or above 30% canopy within 60 m, through yellow, to red at zero.
Attribution
Tree canopy: Meta/WRI Global Canopy Height (1 m, 2020). Buildings: Overture Maps. Threshold: 30% canopy within 60 m, after Ziter et al. (2019). Analysis: Dr Thami Croeser.
Please keep the attribution line with the image. If you need a variant sized for a photo credit, or a crop framed on a particular neighbourhood, get in touch and we’ll produce it.