Switzerland’s cities are running short of shade
Global Urban Canopy & Heat Exposure Study
Even in green, temperate Switzerland, the tree canopy that keeps homes cool is thinner than it looks. We mapped tree cover around every building in 13 Swiss cities — 1.46 million buildings in all — and checked how many have the shade they need to stay safe as summers heat up.
The pattern is consistent across the country: most buildings fall short of the canopy needed to blunt extreme heat.
- 72–94% of buildings sit below the 30% tree-canopy threshold linked to meaningful cooling.
- Geneva and Lugano fare best, yet still leave roughly three-quarters of buildings under the mark.
- Lucerne, Olten, Fribourg and Thun are the most exposed, each leaving over 92% of buildings short of shade.
- Zurich, the largest, leaves 86% of its half-million buildings below the threshold.
What we measured
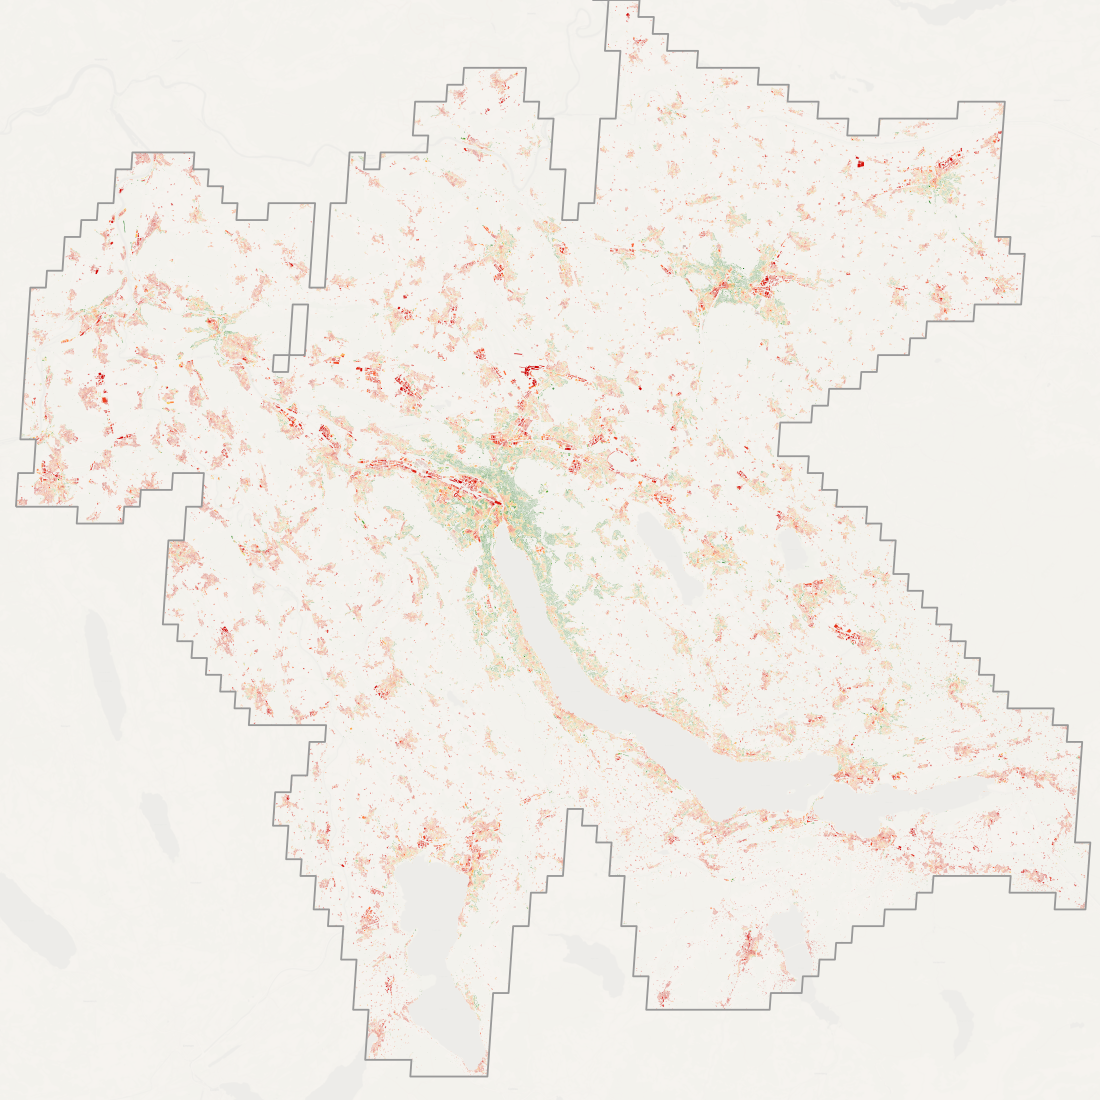
For every building, we measured the share of tree canopy within 60 metres — the zone close to home where shade actually cools the air you live in. A park across town does little for your street. We used 30% canopy within 60 m as the heat-safe minimum, following the widely cited “3-30-300” rule for urban greening.
Each coloured unit above is a single building. Red means bare; green means adequately shaded. Scroll through the cities and the pattern repeats: dense cores and valley floors run hot and treeless, while the green clusters cling to lakeshores, hillsides, and older leafy quarters.
The ranking
How far off are we?
It is not just that most buildings are below the threshold — it is how far below. In most cities, a large share of buildings have less than 10% canopy nearby. Drag the slider below: even at a lenient 20% target, the deficit barely eases.
Where the heat lands
Sparse canopy and hard surfaces produce urban heat islands — places that soak up sun and stay hot. The maps below show building-level land-surface temperature during the hot season. Read them as a relative heat-exposure indicator (surface temperature runs hotter than the air, and this is a peak composite), not a thermometer reading. The hottest zones line up closely with the barest canopy.
Why it matters
Trees are among the cheapest, most effective tools a city has for cooling homes — but only where they are close to where people live, given space and water to grow, and protected long enough to mature. Canopy planted today will not shade a building for 15–20 years, so the deficits mapped here are the result of decisions made a generation ago. Closing them starts now.
A note on the data. These figures come from a global, satellite-based model covering ~9,000 cities — suitable for mapping and screening, not a substitute for local field survey. Surface temperature is a hot-season maximum and a relative indicator. City extents are functional urban areas (commuting-zone scale). See Methods & Data for full detail and caveats.
Global Urban Canopy & Heat Exposure Study, 2026. Canopy: Meta Canopy Height Model v2 (≥2 m). Surface temperature: Landsat 8/9 hot-season maximum (2022–2024). Buildings: Overture Maps. City boundaries: GHSL Functional Urban Areas. Population: GHS-POP R2023A.